 Omer Schneider
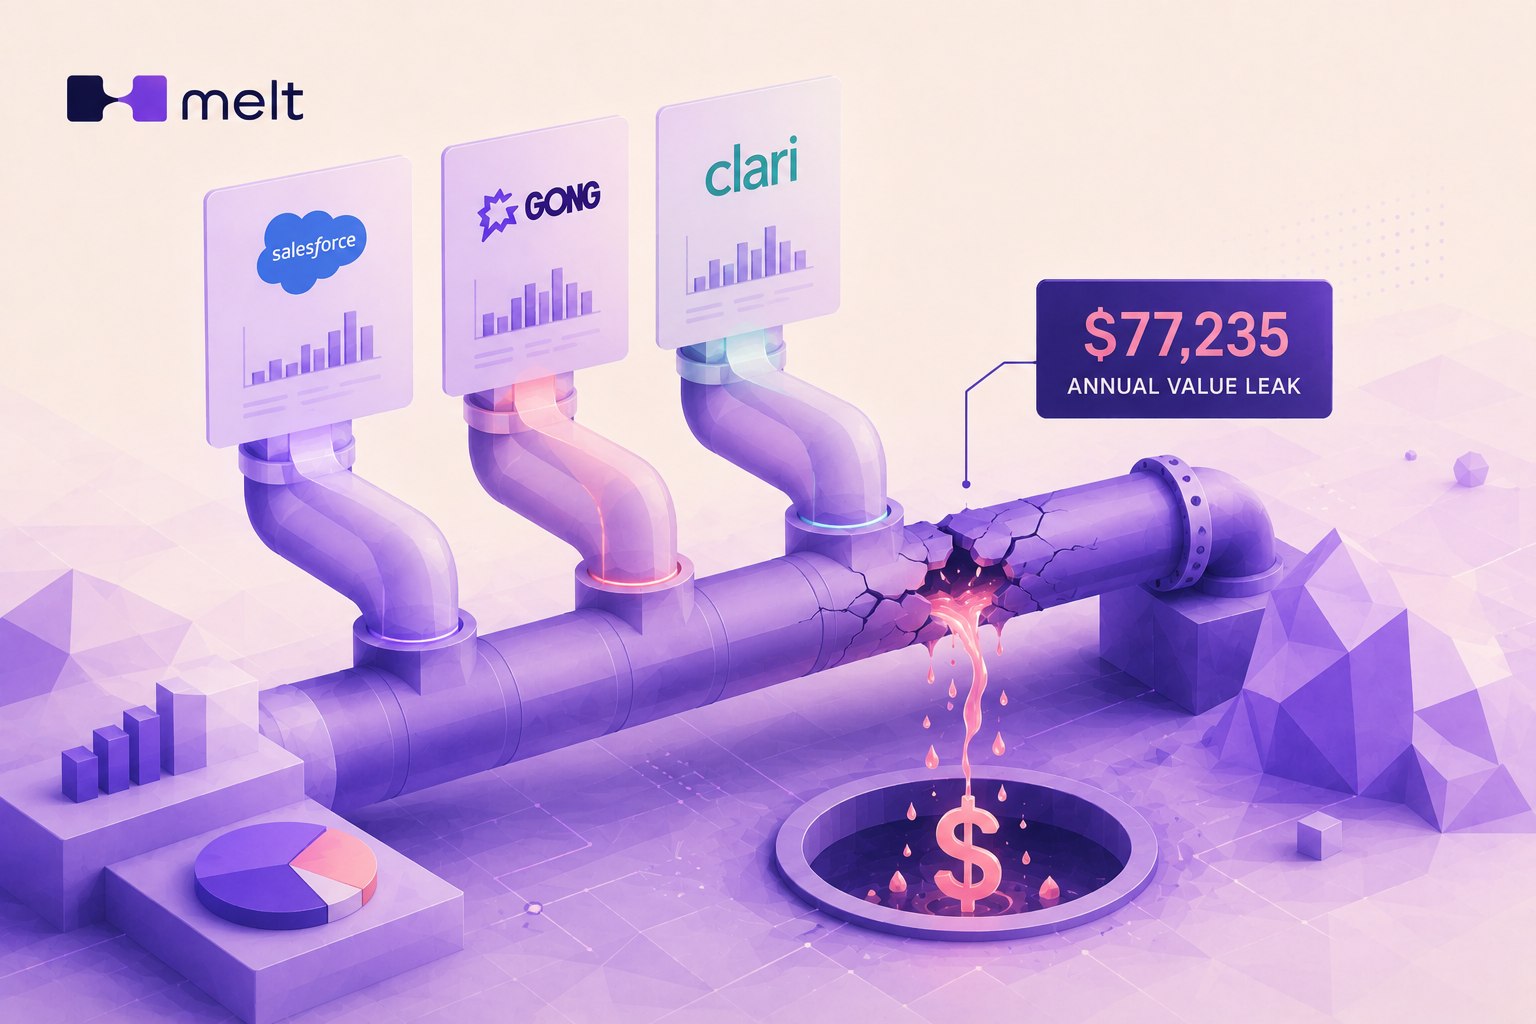
Frameworks are only useful if they produce a number. Here's what one real scan found on a pre-IPO fintech doing $1.5B a year in originations, running Salesforce, Gong, and Clari, three tools most sales organizations would already call "AI-enabled" without a second thought.
The approach
Pull 14 business days of historical logs across the three systems, model the behavioral patterns in those logs, and quantify exactly where capital was leaking. No new system access requested beyond what was already being logged. Pro-forma annual margin leak uncovered: $77,235 a year, across four findings.
Four findings, none of them visible on a usage dashboard
Gong coaching, 29% open rate. Reps were bypassing automated call summaries entirely and logging notes from memory instead, duplicating work the tool was already doing. Of 35 briefs generated, only 10 were opened.
Clari forecasts, 62% override rate. Reps typed guessed close dates directly into Salesforce, corrupting the forecasting model's inputs and forcing managers to manually override it on 8 of the last 13 cycles.
Salesforce pipeline, 4.2-day lag. New clients were handed off from Sales to Customer Success manually, over Slack, with no system connecting the two, stalling onboarding by an average of 4.2 days per deal.
Salesforce routing, 32% manual. Lead-assignment automation broke every time a rep left or a territory shifted, so operations was manually reassigning roughly a third of leads by hand each morning.
Why a dashboard would have missed all four
A standard usage dashboard would have shown Gong as "adopted," it was installed and generating briefs, and Clari as "active," forecasts were being generated on schedule. The leak was only visible one layer down, in the gap between what the tool produced and what the humans around it actually did with it. Usage and value are correlated. They are not the same measurement, and the gap between them is exactly where the money was.
The smaller finding that led to the bigger one
One of these four findings, investigated one level deeper, turned into something larger. The 4.2-day Sales-to-CS gap was worth asking a single, specific question about: what actually happens between a signed contract and Customer Success? The answer, a person manually emailing a broker by hand, led to reconstructing 14 related workflows in 10 days, from just two stakeholder conversations, surfacing three additional AI opportunities worth $420K in combined annual value, the largest single opportunity worth $180K on its own, with an estimated four-month payback. The size of a leak you can see from the outside is rarely the size of the opportunity underneath it.
Where to go from here
This is what reading the systems instead of scoring a matrix actually looks like in practice, one dollar figure at a time, tied to a real log line instead of a workshop estimate.
Frequently asked questions
What tools were involved in this AI value leak example?
Salesforce, Gong, and Clari, at a pre-IPO fintech doing $1.5B a year in originations. All three were already considered "adopted" by the company's own usage dashboards.
How was the $77,235 annual leak figure calculated?
By pulling 14 business days of historical logs across the three systems, modeling the behavioral patterns in those logs, and quantifying four specific findings against source-system data, not estimates.
Why didn't the company's existing dashboards catch these leaks?
Because usage dashboards measure whether a tool was opened, not what the person did after opening it. Reps who opened a Gong brief and still took notes from memory, or overrode a Clari forecast with a guess, still counted as active users on a dashboard.